Search Bar
2 Content Analytics
The first time logging into Google Analytics can be overwhelming, but don’t be disheartened. We’ll break down the basics and demystify these the seemingly random tables, graphs, and charts.
A note on the Search Box
Google Analytics has frequent updates, so the menu structure and organization of the reports change often. For this reason, we’ll rely on the search function to find reports and other features whenever possible.
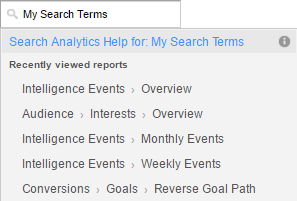
Clicking your mouse into the search box window loads a dropdown menu with a list of the most recently viewed reports. Type the name of a report, dashboard, or shortcut, and a dropdown menu loads with the search results.
If you don’t see the report you’re looking for in the results, click on the blue text above the search results to search Analytics Help for more information.
My Search Terms: Search Analytics
The Audience Overview Report
Google Analytics - May 5, 2016
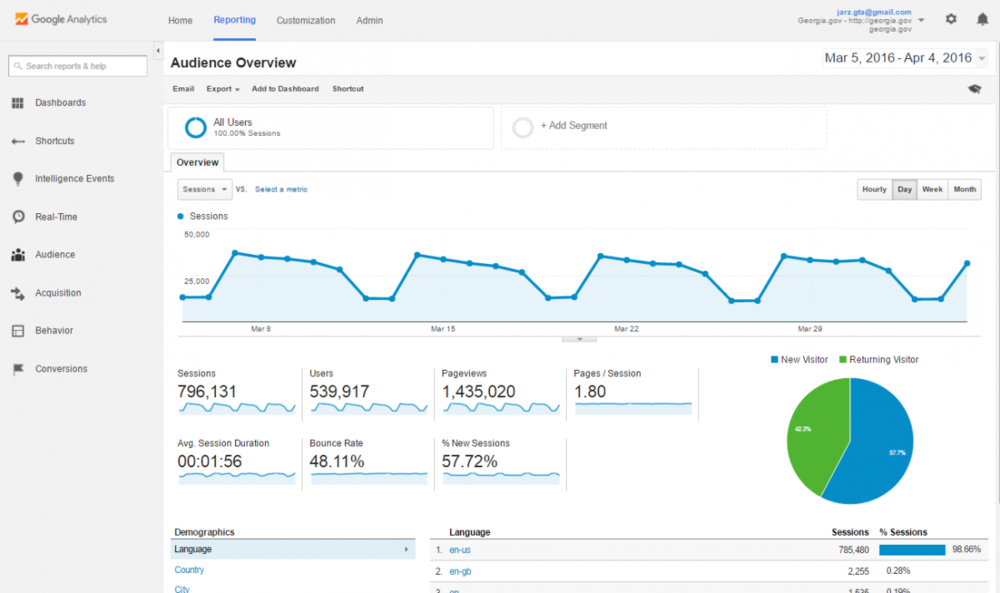
The Audience Overview is the default screen you’ll see when you access your site’s analytics reports. This report gives you a glimpse at who your visitors are. It includes graphs, percentages, and pie charts on pageviews, unique visitors, average time on page, entrance, bounce rates, and exit rates on your website as a whole. You can adjust the date range for the totals with the date selector in the top-right corner of the page. You can also break the time interval of the graph to be in hours, days, weeks, or months.
Here are some key definitions you’ll need:
- Pageviews - A view, or load request, of a specific page. It’s the total number of times visitors downloaded a page during a specific date range. This includes the same person looking at your page 15 times in one session, or 15 different people looking at your page one time.
- Unique Pageviews - These are pageviews made by unique, or individual, visitors in your specific date range. This number represents those 15 different people looking at your page in one session (15 unique pageviews), rather than the one person refreshing or reloading their screen (one unique pageview).
- Average Time on Page - The average time visitors are staying on that page. This may not be something you need to be overly concerned about, but it is a good indicator if people are sticking around (let’s say on a blog or press release page, you’d like this number to be higher than normal) or if people are finding what they need quickly (on an FAQ or Forms page where visitors are finding what they need and leaving, you’d like this number to be low).
- Entrance - The number of visitors entering your website through that specific page. Your homepage should have the highest number of entrances, unless there is an internal page that ranks high in Google search results.
- Bounce Rate - This percentage shows the rate of single-page visits to your website. If someone visits a page of your website, and then exits that same page (leaving your website completely), that counts towards your bounce rate.
- Exit Rate - Not to be confused with the Bounce Rate, this rate is the percentage of site exits from your website, regardless of how many pages a user has viewed. It’s calculated by dividing exits into total pageviews, and therefore is never 100%.
- Unique Visitors - This is the number of users visiting your website. The initial session by a user during your specific date range is counted as a visit and a visitor. Much like the unique pageviews, this only counts visits by users once, and not every time they visit the website during your specific date range.
- Visits - The number of individual sessions started by all visitors to your website, no matter how many sessions they start. If a user is inactive on your site for 30 minutes or more, any future activity is attributed to a new session. Users that leave your site and return within 30 minutes are counted as part of the original session.
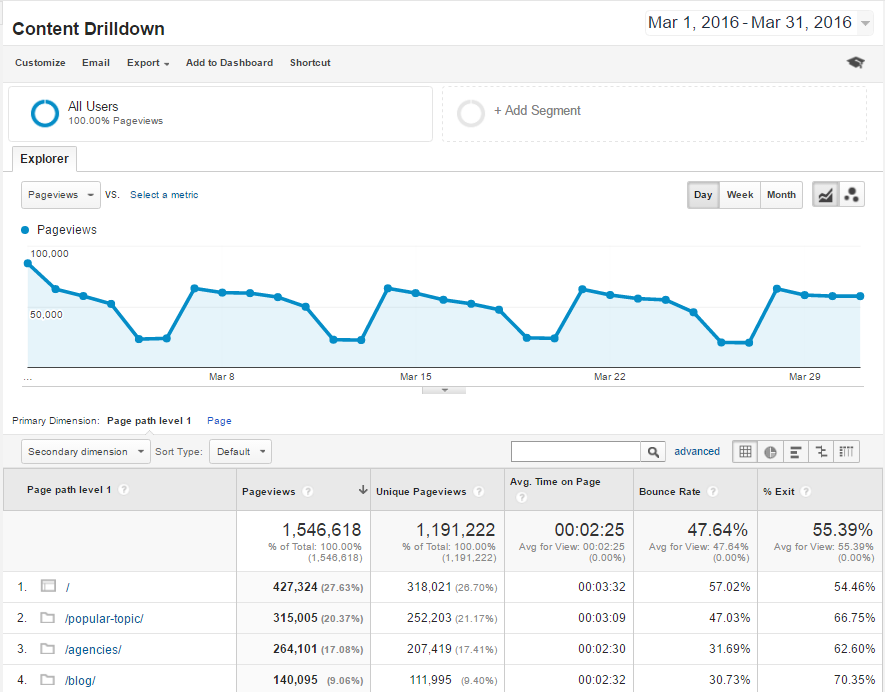
The Content Drilldown Report
To see how individual pages on your website are performing, type “Content Drilldown” in the search box to load the Content Drilldown report. The report shows the highest level pages of your website. If your folder has a “/” at the end of its name, that means there are children pages within it. Click the folder to access the lower level pages.
Content Drilldown
Site Search Report
You can also use Google Analytics to see what people search for when they get on your website. Type “Search Terms” into the search box and select the Search Term report for Site Search. There you’ll find a list of the most commonly searched terms when people use the search box on your website. This information can be really useful, especially when you’re considering restructuring or reorganizing some of your content.
Putting it all together with content inventories and audits
We’ve covered enough to get you started on a content inventory. Download this template and list all the pages and media content of your website and their associated Google Analytics values. To perform a content audit, analyze the strengths and weaknesses of all of your inventoried items, and use that assessment to see what needs adding, what needs tweaking, and what needs removing.
As your team runs through the inventory, you should ask yourselves questions like:
- Is some of the content irrelevant? If you’ve got pages and media that barely get any traffic, ask yourself if they are necessary to the website. If you can delete it, you should, because extraneous content wastes storage space, clutters your directories, can confuse your team, and is a liability with search engines. Outdated forms, pages for defunct programs, and any redundant files are all examples of content you should delete.
- Is there an important file or form that needs to be moved so it can be easier to find? If you’re seeing low traffic on important pieces of content, you may need to move it elsewhere in your navigation to get it the attention it deserves.
- Are users frequently searching for a certain document or page? If you’re seeing a lot of people using search to find content, you’ve got a problem. If the content isn’t available on your website, you should add it. If the content already exists, you should reconsider relocating where the content is in the menu structure or highlight it on your homepage for quick access.
- Is my content or navigation making it too difficult for users to find what they’re looking for? Look at the Pages report for Site Search to find out what pages your visitors are on when they give up on your navigation menu and just use the search box. You may want to consider restructuring and reorganizing the content.