Google Analytics - Unique Visitors
An official website of the State of Georgia.
The .gov means it’s official.
Local, state, and federal government websites often end in .gov. State of Georgia government websites and email systems use “georgia.gov” or “ga.gov” at the end of the address. Before sharing sensitive or personal information, make sure you’re on an official state website.
Still not sure?
Call 1-800-GEORGIA to verify that a website is an official website of the State of Georgia.
The more you poke around Google Analytics, the more tips and tools you’ll find. It’s easy to get bogged down by the idea of trying to juggle so many different reports and findings. Luckily, the folks at Google came up with a way to make monitoring a lot of diverse information easier for you!
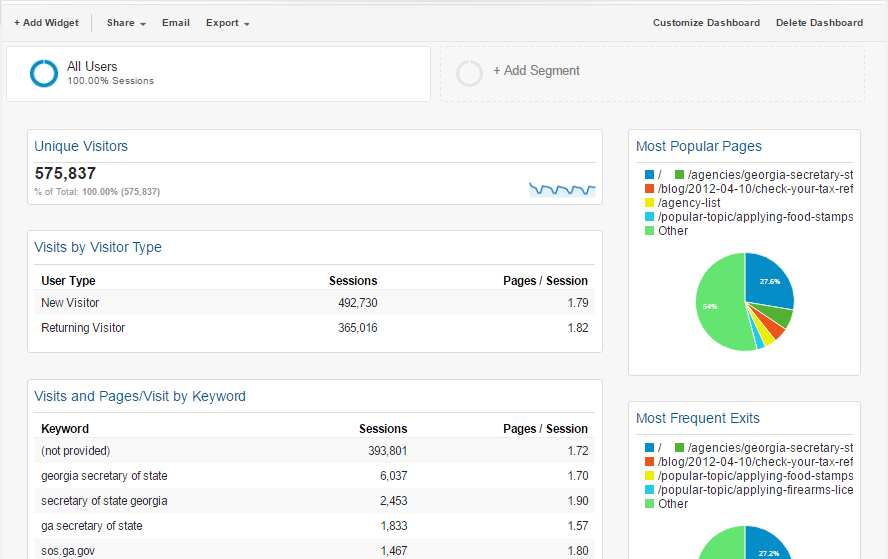
Google Analytics dashboards are collections of widgets that allow you to quickly visualize your data. Dashboards let you monitor many metrics at once, so you can quickly check the health of your accounts or see correlations between different reports. Dashboards are easy to create, customize and share.
To create a new dashboard, click the +New Dashboard button within the Dashboards menu. You can add any widget of information Google provides to one screen, up to twelve widgets per dashboard. You can have up to 20 dashboards on your account, so you can target different dashboards for different tasks.
We recommend checking your analytics data monthly. That’s a large enough sample for you to see meaningful patterns but specific enough to monitor the effects of any changes you put in place. If you aren’t able to commit to a monthly review, you should at least take a look every quarter if you want reliable insight. If you are planning any significant changes to your website such as moving, adding, or removing content, you should make a point to schedule follow-up analytics reviews to see how those changes affected your users.
With the rapid changes in technology and the constantly evolving needs of the public, web analytics provides a streamlined, highly effective tool to help governments develop websites and web services more easily, quickly, and inexpensively than ever before. Don’t let the newness of the technology deter you—the time and effort you put in has many returns!