Illustration: Analytics Tell The Story

An official website of the State of Georgia.
The .gov means it’s official.
Local, state, and federal government websites often end in .gov. State of Georgia government websites and email systems use “georgia.gov” or “ga.gov” at the end of the address. Before sharing sensitive or personal information, make sure you’re on an official state website.
Still not sure?
Call 1-800-GEORGIA to verify that a website is an official website of the State of Georgia.
August 22, 2017
If you’ve worked with us before, you know that you need to keep your audience’s needs at the forefront of your digital strategy. Your menu structure, homepage layout, and top content pieces should reflect what users need and how they think.
But, how do you get inside their mind? And how do you know if your website has improved over time?
A popular tool we love to use is Google Analytics. If you’re on our platform, your team should already have access to the analytics for your site. (And if you don’t, let us know.)
There’s a lot to Google Analytics. If you log in and you’re not quite sure what you’re looking for, it can quickly become overwhelming and counterproductive.
Where do you even start?
Well you don’t have to be an expert to learn important information from your analytics. There are a few key pieces of data — called “reports” — that we recommend you keep an eye on.
Note: You can find each of these reports just by searching at the top of the side navigation.
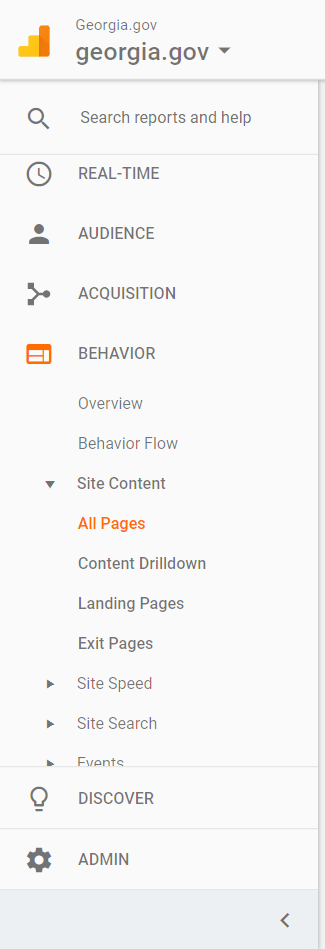
The “All Pages” report shows you — you guessed it — all of the pages on your site. You can see which pages get the most views, how long people stay on those pages, and how often people leave your site from them.
Google is your homepage. We can’t expect our audience to know who we are and what our URL is. More often than not, they get to our site by searching and finding one of our pages in the results. This means that their first impression of your site can be any page of the site.
Take a look at your top landing pages to know what people see first. Do these pages make sense on their own? Will someone going straight to this page from Google understand it without the context of the rest of your site?
A great way to better understand your audience is by looking at what they search for on your site.
Not sure if you should call it “jobs” or “employment”? See what language your audience uses!
Are a lot of people searching for one particular thing? Maybe it should be more obvious in your navigation or homepage.
And what if people are looking for something on your site that you don’t offer? Nothing’s more frustrating than going to a site, expecting to find something, and finding absolutely nothing. If this is a common confusion, you could create a simple page about it. Just explain why you don’t offer information on this topic, and point off your site to where they can learn more. This will clarify that question and maintain a positive impression.
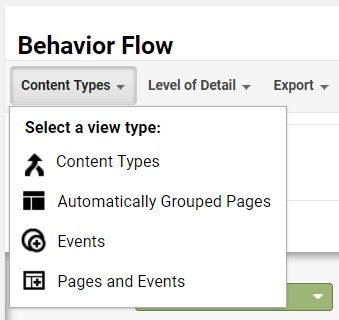
How do users navigate your content? You can study behavior flows to see what pages people come from, and what they go to next.
Spend some time with this report. Check out the options under the dropdown menu just under the report title. I’d recommend looking at the Pages and Events view. From here, you’ll be able to choose one page out of your top 50 to see where users go, including documents and pages on other sites. These will be particularly helpful if you have a page with external links, links to PDFs, or links to applications.
Oftentimes, more pageviews makes it look like your content is successful. We want people to come to our site, right?
Be careful when drawing conclusions from your data.
If you see more pageviews, that might mean that your content is successful, but how do you know that people are actually finding what they’re coming for?
Similarly, longer time on page might mean that your content is engaging. But if the page contains a single paragraph and people spend 5 minutes on it, maybe they’re just confused.
And we want to keep people on our site, but if the call to action on your page is for someone to leave the site and go to an application, higher exit rates are a plus.
No piece of data can stand alone. When you look at your most-viewed pages, you can’t always assume that these are successful. See how their popularity has changed over time. Take a look at the page itself and see if the time spent on it makes sense. Look at the flow of traffic to see where people are before going to this page, and where it takes them next.
Almost every report in Google Analytics has the option to share or email the information. You can set up these reports to send regularly to your inbox, great for keeping track over time.
If you want to track several reports at a time, it might be worthwhile to set up a dashboard.
If you don’t have the time to dig through everything on your own, we won’t leave you hanging.
Gain a fresh perspective of your site with our “Explore Your Analytics” worksheet. This will walk you through a few basics of your site analytics with prompting questions and things to think about.
This worksheet comes from our Content Specialist Certification Course. The course is a 6-part series that helps you understand your users and how your website’s content and structure can help them achieve their goals. Much of the course focuses on learning from your analytics, as well as other methods of research. Our next course will start up towards the beginning of next year, so keep an eye on our newsletters to learn when to register.
Google Analytics is a tool that’s frequently changing and updating. In just the past few years, they’ve changed language, organization, and even functionality. And it’s great that they’re staying current! By no means do we wish that the tool would stagnate forever.
But the frequent changes can make it confusing to use when you’re referencing outdated training materials.
For that reason, we recommend that you head directly to Google Analytics’ online help. There, you’ll find:
If you need help understanding some aspect of your data, get your answer straight from the source!